
2009: Initiative 1033 | Overview

Summary: Initiative 1033 was a jobs-killing initiative spearheaded by Tim Eyman in 2009. I-1033 attempted to put a limit on state, county, and local general funds based on the revenue from the year before with adjustments for inflation and population growth. All excess revenue would have been proportionally redistributed in the form of property tax reductions (meaning that large property owners would have been rebated the most). I-1033 would have made it extremely hard for public agencies to recover from recessions and would have removed discretion of where revenue is appropriated from our elected representatives. Initiative 1033 was similar to a measure passed in Colorado that was repealed after it endangered the state’s fiscal health and economic competitiveness. I-1033 was overwhelmingly rejected by Washington voters.
On the ballot
| Ballot Title: | Initiative Measure No. 1033 concerns state, county and city revenue. This measure would limit growth of certain state, county and city revenue to annual inflation and population growth, not including voter-approved revenue increases. Revenue collected above the limit would reduce property tax levies. | |
| Filed on: | January 5th, 2009 | |
| Before Voters In: | November of 2009 | |
| Sponsors: |
Tim Eyman, Jack Fagan, Mike Fagan | |
| Fate: | Overwhelmingly defeated by voters | |
| Election Results: | Yes: 42.10% (729,918 votes) | No: 57.90% (1,003,943 votes) |
| Election Turnout: | 57.77% (percentage of registered voters who voted) | |
| Petition Drive: |
|
|
| Complete Text: | Available (PDF) | |
| Ballot Summary: | This measure would limit growth in state revenues deposited in funds subject to the state expenditure limit, and limit growth in county and city revenues deposited into the county and city current expense funds. The limit would be adjusted based on annual growth in inflation and population. The limit also would apply to revenues transferred out of these funds. The limit would exclude voter-approved revenue increases. Revenues above the limit would reduce property tax levies. | |
County-by-county election results
Counties that voted yes are shown in gray; counties that voted no are shown in purple.
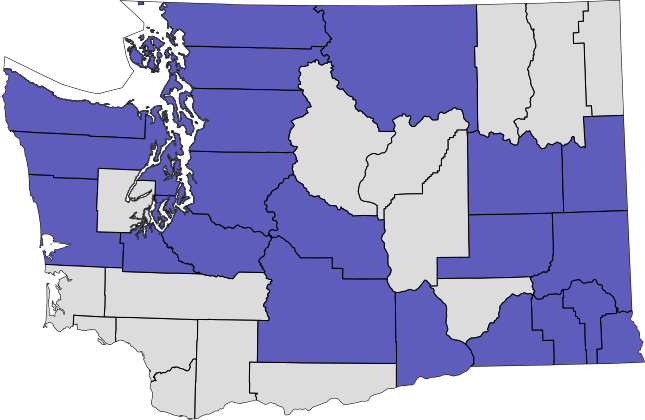
See full breakdown (abstract in XLS) or archived elections results map.
Explanatory statement
The following is the explanatory statement prepared by the Attorney General’s office in advance of the November 2009 general election.
The Law as it Presently Exists
State and local governments receive revenue through taxes and fees. Some of the rates for these taxes and fees are set by elected representatives in the state Legislature, or in the case of certain local taxes, by local city councils, county councils, or boards of county commissioners. Local taxes may be imposed only if they are authorized by state law. The rates for taxes paid to the State of Washington are set in statute by the Legislature. The voters may also enact laws regarding taxes by initiative or, if applicable, by referendum. Some local taxes can only be imposed if the local voters approve them. State law also permits the assessment of certain fees by state or local agencies, as authorized by the Legislature.
The State deposits much of the revenue that it receives from taxes and fees into the state general fund and into accounts referred to by the law as “related funds.” Cities and counties place much of the revenue that they receive from taxes and fees into local “current expense funds.” These funds are similar in nature to the State’s general fund. State law limits spending from the State general fund and “related funds” to the prior year’s expenditures from those funds, increased by the average growth in state personal income for the prior ten years. The spending limit does not apply to city and county expenditures.
The state constitution and state statutes limit the maximum amount of revenue that state and local governments may collect from property taxes in a given year, and the amount that property taxes may be increased each year. The state constitution generally limits the total of all annual property tax levies on a particular property to no more than 1% of its true and fair value, unless voters approve higher property taxes. In addition, by statute, the total amount of money that any state or local jurisdiction receives from property taxes may only increase by 1% per year, or the rate of inflation. Total property tax revenue for each jurisdiction can only go up by more than this amount if the voters of that jurisdiction approve the increase by a majority vote. Property taxes for particular parcels may increase or decrease by more or less than that amount, depending on changes in assessed valuation or new construction. Property taxes are levied by both state and local governments. Local property taxes are levied by cities, counties, and special districts, either by the elected representatives or through voter approval of specific property tax levies.
The Effect of the Proposed Measure if Approved
This measure would limit the growth of revenue to the State’s general fund and “related funds,” and to cities’ and counties’ local “current expense funds,” based on an annual rate of inflation and population growth. If the State or any city or county receives revenue in a given year above the revenue limit established by the measure, then it must deposit the revenues above the limit into a separate account, and reduce the amount that it otherwise would be authorized to levy in property taxes in the following year by that amount.The limit on revenue growth would not apply to revenue increases approved by the voters at an election, and money received from the federal government would not be included in the State’s revenue limit. The inflation rate used to calculate the revenue growth limit would be based on the implicit price deflator for the United States. The limit on state general fund revenue also would be based on changes in statewide population, while for cities and counties it would be based on changes in population for each city and county. The revenue limit would be adjusted if the costs of any program or service are shifted to or from the state general fund or local current expense fund to another fund, or if revenue is transferred from the state general fund or local current expense fund to another fund.
Source: Archived Washington State Voter’s Pamphlet
Fiscal impact statement
The following is the fiscal impact statement prepared by the Office of Financial Management in advance of the November 2009 general election.
Fiscal Impact through Calendar Year 2015
Initiative 1033 limits annual growth of state, city and county general fund revenue to the rate of inflation and population growth. General fund revenues exceeding this limit must be used to reduce the following year’s state, city or county general fund property tax levy. The initiative reduces state general fund revenues that support education; social, health and environmental services; and general government activities by an estimated $5.9 billion by 2015. The initiative also reduces general fund revenues that support public safety, infrastructure and general government activities by an estimated $694 million for counties and $2.1 billion for cities by 2015.
General Assumptions
The initiative is set on a calendar year (CY) basis. CY 2010 revenue limit is calculated as follows: CY 2009 General Fund Revenue × (1 + 2009 % Change Population) × (1 + 2009 % Change Inflation)
CY 2010 general fund revenues that exceed the CY 2010 revenue limit will be transferred into new “Lower Property Tax Accounts” for the state, counties and cities. The first transfer(s) into the new accounts will occur in CY 2011.
The first property tax levy to be reduced by the initiative is the 2011 levy, which is collected in CY 2012. Thus, funds will be transferred from the new “Lower Property Tax Accounts” into state, county and city general funds in CY 2012 to account for any reduction in 2011 levies.
State Revenue Estimate – Assumptions
The initiative defines state general fund revenue as the aggregate of revenue from taxes, fees and other governmental charges received by state government that are deposited into any fund subject to the state’s expenditure limit under RCW 43.135.025. For CY 2009 and CY 2010, state general fund revenues are General Fund – State revenue estimates from the June 2009 Washington State Economic and Revenue Forecast Council converted from a fiscal-year basis to a calendar-year basis.
The following state revenue sources, totaling less than $30 million annually, have been excluded from these estimates:
- Sales and income from property.
- Contributions and grants.
- Grant and loan repayments.
- Indirect and prior cost recoveries.
- Unclaimed property.
- Charges for publications and documents.
- Interest and investment earnings.
State general fund revenues for CYs 2011–15 are estimated to grow, on average, by the change in real per capita personal income plus change in inflation plus change in population, adjusted for revenue elasticity. This methodology is consistent with prior long-term revenue forecasts produced by the Office of Financial Management (OFM), and results in an average annual growth rate of 4.8 percent.
State general fund revenues are reduced by the amount required to be transferred into the Budget Stabilization Account created under Article 7, Section 12, of the Washington State Constitution.
The initiative defines inflation as the annual percentage change in the Implicit Price Deflator for Personal Consumption for the United States as published on or about March 27 each calendar year by the Bureau of Economic Analysis and reported by OFM. Inflation estimates for CY 2009 and CY 2011 are from the June 2009 Washington State Economic and Revenue Forecast. Inflation estimates for CYs 2012–15 are from the June 2009 IHS Global Insight forecast of the Implicit Price Deflator for the United States. The Washington State Economic and Revenue Forecast Council relies on IHS Global Insight models and data for the U.S. portion of the official state economic forecast.
The initiative defines population growth as the percentage change in the statewide population based on the annual statewide population determinations reported by OFM during the prior calendar year and the current calendar year. Statewide population growth estimates are from OFM’s 30-Year Forecast of the State Population.
Estimated STATE Cash Receipts:
FUND CY 2010 CY 2011 CY 2012 CY 2013 CY 2014 CY 2015 General Fund – State 0 ($676,000, 000)
($875,000, 000)
($1,125,000, 000)
($1,447,000, 000)
($1,803,000, 000)
Lower State Property Tax Account 0 $676,000, 000
$875,000, 000
$1,125,000, 000
$1,447,000, 000
$1,803,000, 000
State Costs to Implement – Assumptions
Less than $50,000 will be incurred by OFM in CY 2009 and CY 2010 to set up, test and verify computer systems, and establish policies and practices to implement a state general fund revenue limit
County and City Revenue Estimate – Assumptions
The initiative applies to counties, first class cities, second class cities, code cities, towns and unclassified cities.
To account for possible different patterns in population and revenue growth, counties and cities were analyzed using four groupings:
- Urban County – 7 counties
- Rural County – 32 counties
- Cities in Urban Counties – 109 cities and towns
- Cities in Rural Counties – 172 cities and towns
Urban counties are Clark, King, Kitsap, Pierce, Snohomish, Spokane and Thurston; all others are rural counties. Under RCW 82.14.370, rural counties are defined as a county with a population density of less than 100 persons per square mile or a county smaller than 225 square miles as determined and published each year by OFM for the period July 1 to June 30.
County and city general fund revenues are defined as the aggregate of revenue from taxes, fees and other governmental changes received by the county or city and deposited into the county current expense fund or city general fund, respectively. County and city revenues are estimated from 2007 financial information contained in the Local Government Financial Reporting System (LGFRS) of the Washington State Auditor’s Office. Only funds reported within LGFRS as general fund revenues are assumed to be deposited into the county current expense fund or city general fund, and therefore, are included in these estimates.
The following county and city revenue sources have been excluded from these estimates:
- Federal and state direct and indirect grants.
- State shared taxes or revenues.
- Charges for contracted services performed by counties or cities.
- Charges for enterprise activities or charges that are not governmental in nature.
- Inter-fund and inter-department charges.
- Interest and investment earnings.
County and city general fund revenue growth rates for CYs 2009–15 are related to the state’s revenue growth rate by estimating each grouping’s five-year historical rate of revenue growth in proportion to the state’s revenue growth rate of 4.8 percent.
Inflation estimates for counties and cities are the same as used for the state.
Population growth is defined as the percentage change in the countywide population for counties and the percentage change in citywide population in cities, as reported annually by OFM. County and city population growth is estimated from OFM’s 30-Year Forecast of the State Population, adjusted using OFM’s Washington State County Growth Management Population Projections: 2000-2030 and each grouping’s historic population growth rates.
Estimated URBAN COUNTY Cash Receipts:
FUND CY 2010 CY 2011 CY 2012 CY 2013 CY 2014 CY 2015 General Fund – Urban Counties 0 ($55,000, 000)
($70,000, 000)
($87,000, 000)
($111,000, 000)
($137,000, 000)
Lower County Property Tax Accounts 0 $55,000,000 $70,000,000 $87,000,000 $111,000, 000
$137,000, 000
Estimated RURAL COUNTY Cash Receipts:
FUND CY 2010 CY 2011 CY 2012 CY 2013 CY 2014 CY 2015 General Fund – Rural Counties 0 ($24,000, 000)
($35,000, 000)
($46,000, 000)
($58,000, 000)
($72,000, 000)
Lower County Property Tax Accounts 0 $24,000,000 $35,000,000 $46,000,000 $58,000,000 $72,000,000 Estimated CITIES IN URBAN COUNTIES Cash Receipts:
FUND CY 2010 CY 2011 CY 2012 CY 2013 CY 2014 CY 2015 General Fund – Cities in Urban Counties 0 ($176,000, 000)
($257,000, 000)
($350,000, 000)
($463,000, 000)
($588,000, 000)
Lower City Property Tax Accounts 0 $176,000, 000
$257,000, 000
$350,000, 000
$463,000, 000
$588,000, 000
Estimated CITIES IN RURAL COUNTIES Cash Receipts:
FUND CY 2010 CY 2011 CY 2012 CY 2013 CY 2014 CY 2015 General Fund – Cities in Rural Counties 0 ($30,000, 000)
($42,000, 000)
($55,000, 000)
($72,000, 000)
($91,000, 000)
Lower City Property Tax Accounts 0 $30,000, 000
$42,000, 000
$55,000, 000
$72,000, 000
$91,000, 000
County and City Costs to Implement – Assumptions
County and cities will incur indeterminate costs to implement the initiative during CY 2009 and CY 2010 to modify computer systems, establish policies and practices, train employees and respond to requests for public information. Costs will vary by jurisdiction and depend, in large part, on the jurisdiction’s ability to modify accounting systems to identify and track revenues subject to the general fund revenue limit.
Source: Archived Washington State Voter’s Pamphlet
Voter’s pamphlet argument against I-1033
The following is the text of the argument that appeared in the November 2009 voter’s pamphlet urging a no vote on I-1033, including the rebuttal.
Eyman’s latest initiative is already a proven failure.
Tim Eyman’s latest initiative uses the same failed formula as the “TABOR” law passed in Colorado, which led to deep cuts to public schools, roads and highways, and children’s health care. It did so much damage to the state’s economy that in 2005, Coloradans voted to suspend the law.
I-1033 will make it harder for us to dig out of the recession.
The national recession has cost our state thousands of jobs and forced billions in cutbacks to important local services, like education and health care. I-1033 will force deeper cuts and lock them in for years – meaning more job losses, more hard times for Washington families, and a longer delay waiting for our economy to recover.More bad news for our communities and small businesses.
I-1033 will make things harder than ever for local communities already struggling to maintain basic services such as road repair, libraries and public safety. Small businesses rely on those services, and oppose I-1033 because they will continue to suffer during a prolonged recession.
More damage to our schools, and a deepening health care crisis.
This year we’ve slashed school funding by $1.5 billion, and as many as 3,000 teachers and education employees are facing layoffs. The Eyman TABOR plan will take even more resources away from Washington’s classrooms – and Washington’s kids.
Despite a growing senior population, funding for nursing homes, in-home care and adult day health services are being cut – and 40,000 Washington residents of all ages may lose their Basic Health Plan coverage. Eyman’s TABOR plan will make our health care crisis more severe.
Times are tough enough already – let’s not make them worse. Vote NO on I-1033.
REBUTTAL OF STATEMENT FOR
Initiative 1033 will hurt, not help, Washington’s senior citizens. That’s why AARP Washington and the Washington State Senior Citizens Lobby oppose I-1033. And Initiative 1033 will hurt, not help, working families. That’s why the Greater Seattle Chamber of Commerce, Washington State Labor Council, Washington Association of Churches, and many others oppose I-1033. As we try to recover from the worst recession in decades, Washington just can’t afford another Tim Eyman initiative. Vote NO on 1033.
ARGUMENT PREPARED BY
Doug Shadel, AARP Washington, State Director; Kelly Fox, Washington State Council of Fire Fighters, President; Laura Feshbach, Co-owner Harmatta Construction Inc, Seattle; Teri Nicholson, Registered Nurse, Valley Hospital and Medical Center, Spokane; Mary Lindquist, Washington Education Association, high school Social Studies teacher; Kelley Collen, Assistant Economics Professor, Eastern Washington University, Cheney.
Source: Archived Washington State Voter’s Pamphlet
Further reading
Archived NO on I-1033 campaign website maintained by Permanent Defense